Combine Heat Balance with Data Analytics to Monitor and Detect Changes in Performance

Power Plant Performance Monitoring
- Heat Balance Analysis
- Data Validation & Reconciliation
- Fault Detection & Diagnostics
- Equipment Health
- Asset Management
Combine Heat Balance with Data Analytics to Monitor and Detect Changes in Performance
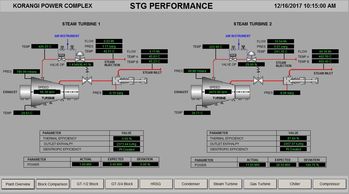
Plant measured data is continuously monitored and evaluated using a combination of first-principles, heat-balance analysis and advanced data analytics. Monitoring output can be stored in plant historian and displayed graphically for operational review.

The MapExDVR application performs heat-balance analysis (conservation of mass and energy plus combustion modeling) to validate and reconcile measured data. The heat-balance calculates all temperatures and flows in the system enabling the evaluation of equipment efficiencies and heat rates. This complete heat balance result provides "virtual sensor" data that may be used by APR and machine learning algorithms to detect abnormal operation.

The most common problem in heat balance analysis is that plant data is missing or contains measurement and calibration error. The MapExDVR application uses least-squared optimization (DVR) to detect and resolve inconsistencies in the data and produce reconciled output (blue line) that is more accurate than the sensor measurement data (red line). A lower feedwater flow measurement at a nuclear power plant can allow a 30 MW power increase.

Performance is evaluated by comparing current performance to predicted (expected) performance. Predicted performance is from SureSense APR (Advanced Pattern Recognition) correlations. The APR correlations are improved by using heat-balance reconciled outputs as inputs to the correlations. APR predictions using only measured data (red line in the figure) are less accurate than hybrid APR correlations that use both measured and reconciled inputs.

Sensor deviations from their expected behaviors are input to a Bayesian Belief Network (BBN) at the equipment level to detect anamolies and identify the probable failure modes. Failure Mode Health values are calculated as the probabliity of a failure given all evidence available at a given time. BBN diagram shows the network used to diagnose generator anomaly.

Equipment health is estimated by a Weibull Proportional Hazard Model (PHM) which incorporates a baseline hazard prediction enhanced by covariant stress factors based on measured and reconciled data. For example the health of the first-stage blades in an aero-derivative gas turbine may have stress factors based on measured high pressure turbine (HPT) exhaust gas tempertures (T48) and the estimated blade metal tempertures (calculated by MapEx).